Environmental and financial savings
Route optimized work orders saves time and fuel and thereby the environment.
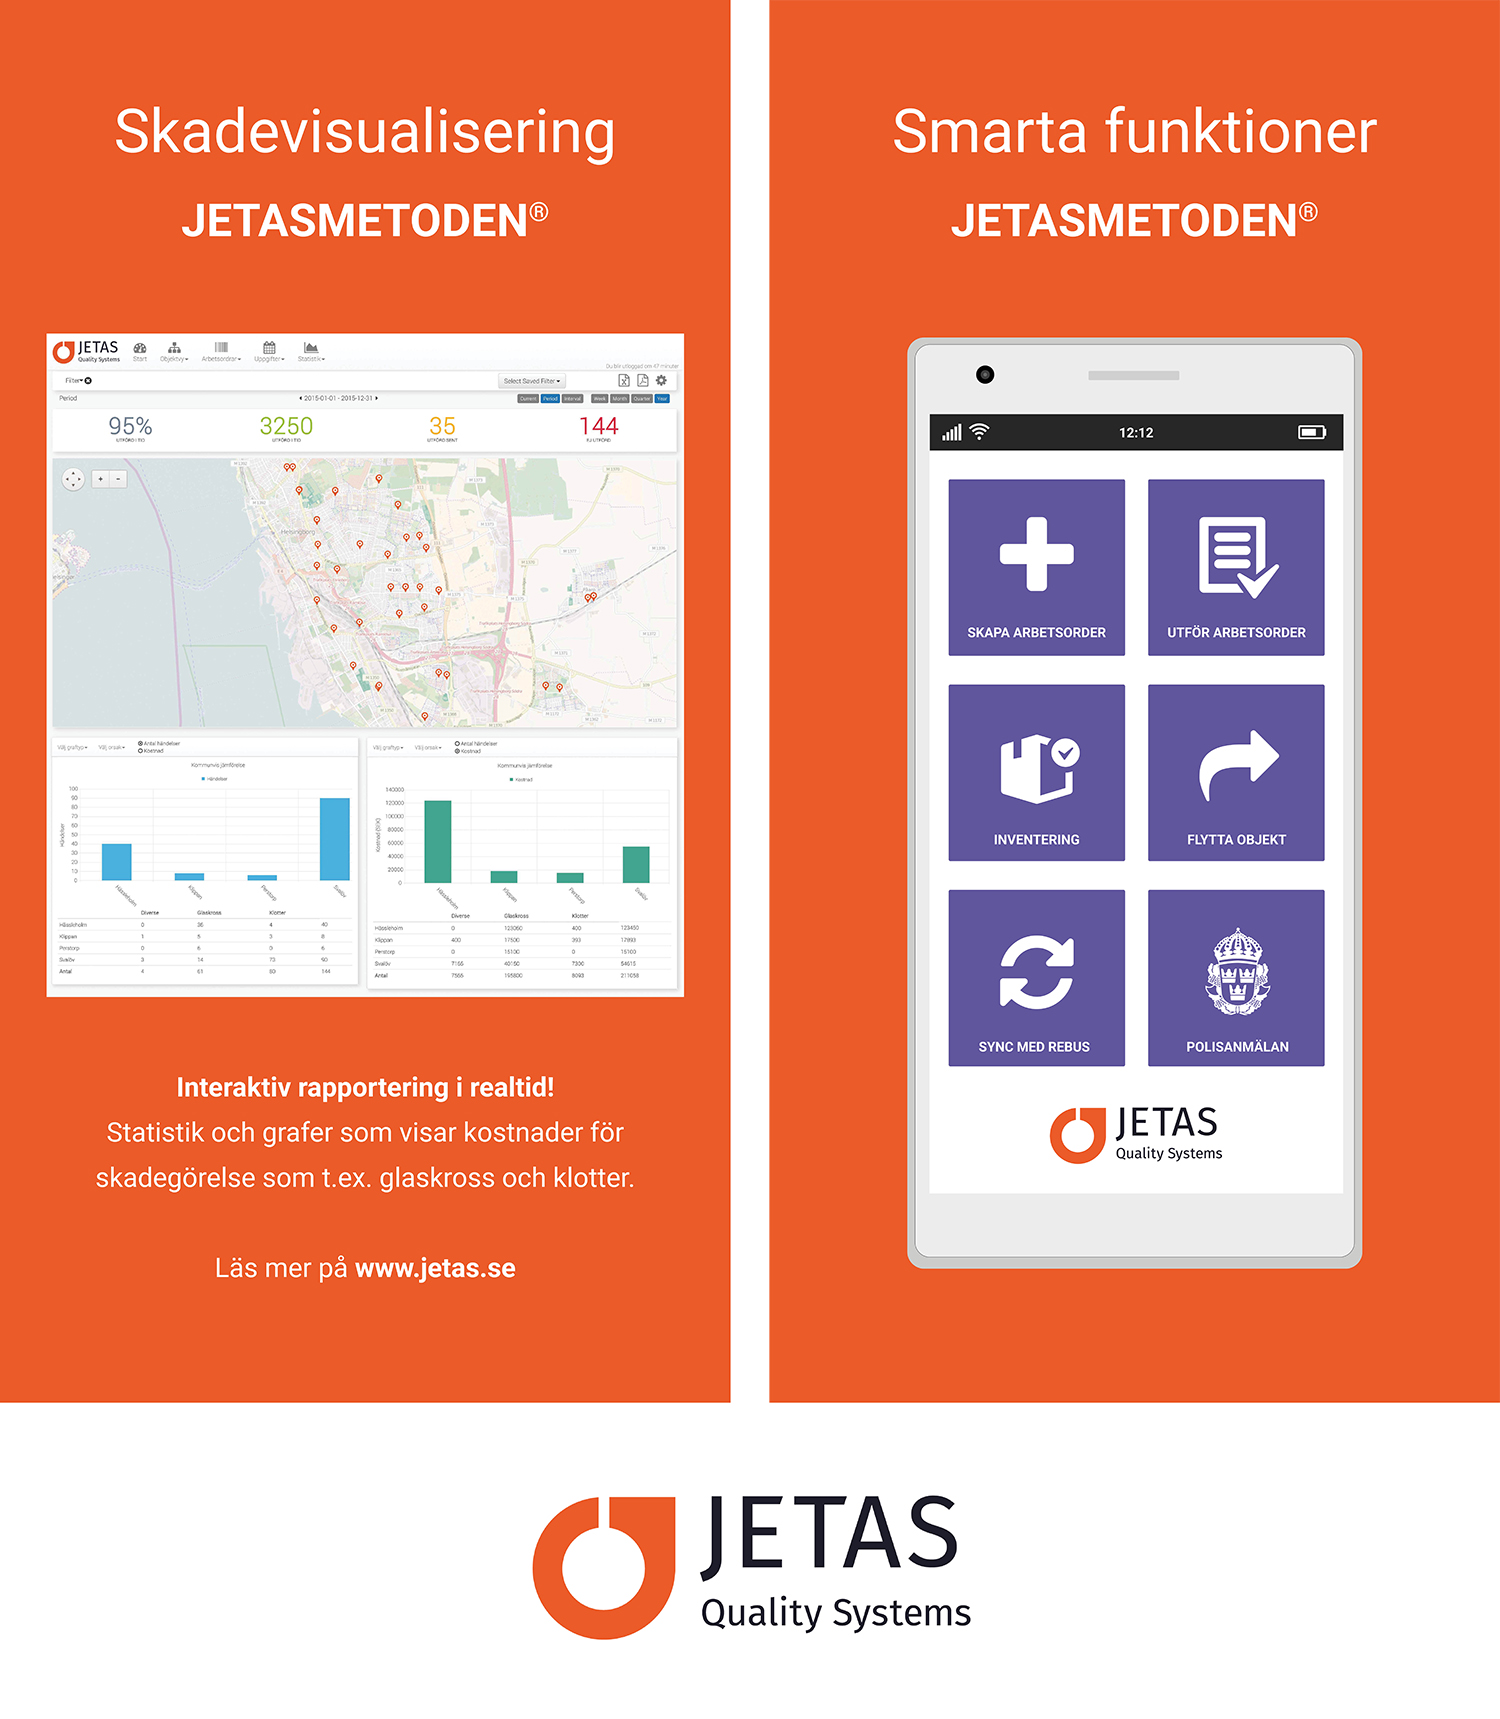
Bus/Train stop maintenance – Technicians and operators will get supervision/maintenance/cleaning work orders according to the maintenance schedule directly to their iPhone, packed with work instructions, equipment lists and navigation support and much more.
Bus/Train stop Inspections – E.g a supervisors can create a survey work order directly at the bus stop and evaluate the status. Giving you a great status overview and indicates the performance level of the service supplier.
Dashboard – Provides instantaneous status of all planned and unplanned work. The Dashboard is the first thing you see when you log on to the system.
Fault complaints – Anyone that discovers an error or a defect can make a service request on the spot, easy and paperless. Helpdesk can register cases directly in the system.
Sustainable and simple
The system is web based and mobile, use any browser at the office and your iPhone on the field! The paperless system will simplify communication and planning. Additionally, it provides environmental and cost savings.
Inventory
With our system, you can perform both full inventory and update of existing information, which is synchronized with existing JETAS registries. The inventory is made by a combination of object photography, drop-down list, check boxes and free text. Reports can be retrieved in real time on eg. number of inventories made during a selected period of time or the most recently completed. Reports can also be filtered on time, location and equipment.
Synkronisering med Rebus
JETAS can be automatically synchronized with Rebus.
Satisfied travelers
Current customers can testify that end customer satisfaction increased significantly while the number of error reports from passengers declined drastically. The system provides a complete overview of all the objects and works – no cases are forgotten.
Analysis of malicious damage – How does it work?
Fast and interactive reporting, map-based with statistics and graphs of vandalism, graffiti, costs, etc. Interactive filters give you just the data you are looking for!


